How to compute reservation coverage (and utilization) from your AWS bill
💡
Starting a new tag called "Dancing Lessons", where we'll teach our cloud bills to do tricks you might have suspected they could do, but not known how to get them to do it.

Today we're going to get our AWS CUR to tell us all about Savings Plan and Reservation coverage in the same report. After we're done with that, we're going to look at how calculate Savings Plan utilization to make sure we're not overpurchasing, or to quantify by how much if we've already made the boo-boo.
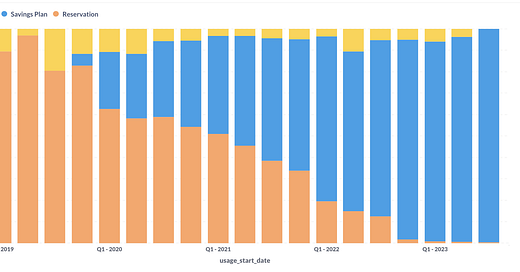
I'm sure you've looked at this one a few times - the AWS reservation coverage report back in cost explorer. This is distinct from the Savings Plan report, which has the exact same shape but lives in a different tab in the cost explorer. I find this situation a little lacking. I wanted these two reports in 1 place, so that I could explain to our stakeholders what a job we were doing managing our discount inventory. See, some years back we decided to stop buying RIs and go all in on SPs, so for years now we've had a blend of the two and keeping an eye on each is a thing. This required me to write a tiny bit of SQL after understanding how these reports are put together.
The first bit of SQL, against your AWS CUR -
CASE
    WHEN line_item_type = 'DiscountedUsage' THEN 'Reservation'
    WHEN line_item_type = 'SavingsPlanCoveredUsage' THEN 'Savings Plan'
    WHEN line_item_usage_type LIKE '%SpotUsage%' THEN 'Spot'
    WHEN line_item_type = 'Usage' THEN 'On Demand'
    ELSE NULL
END AS finops_pricing_model,
This gives us a very helpful column in our bill to slice our usage line items by the billing model they are under at the time of usage.
I have another dimension/column that I can use to explicitly ignore Spot usage and anything not related to hypothetically reservable usage, since I don't really want to report that out in our reservation coverage reporting -
CASE
    WHEN line_item_type IN
    ('DiscountedUsage', 'SavingsPlanCoveredUsage', 'Usage') AND (
        line_item_usage_type LIKE '%BoxUsage%' OR
        line_item_usage_type LIKE '%EBSOptimized%'
    ) THEN 'Reservable Resource'
    -- this value ^^ allows me to target only usage line items for which
    -- a discount _could_ hypothetically apply.
    ELSE 'Non-Reservable Resource'
END AS finops_usage_class,So here's an interesting thing, and why you should really care deeply about the data that you're managing in your FinOps practice. The chart above shows our coverage daily for the first 3 months of this year, reporting the same way that Amazon reports it - using the "on demand" cost of the resource in question to calculate your coverage. This method of reporting will make the coverage appear higher versus the following chart, which rolls up the exact same data but reports on a different metrics - the finops_effective_cost metric, which computes what we're actually paying for these resources.
You'll notice the coverage doesn't appear to be quite as complete, even though it is arguably giving you a more realistic version of actual dollars spent. I want you, reader, to understand my manifesto on this point.
‼️
Whomever best understands the data in a given business area effectively controls that data, and whomever controls the data will most easily control the narrative of what that data represents.
This is why it is absolutely paramount for the FinOps practitioner to have a deeper understanding of the billing data and the technical and business processes that it represents than anyone in their organization.
Now, let's move to the counterpart - savings plan utilization.
Savings plan and reservation utilization
This is one that I'm still learning, and have only come to my current understanding recently. My early months in the AWS bill were spent largely in the line items that represent Usage of some kind or another. The SavingsPlan and Reservation line items were to be dealt with later. Besides, I was able to pull out the cost of our reservations and savings plans in the amortized line item usage columns and get what I needed, but now I find myself in that uncomfortable if inevitable position of being ... overpurchased on Savings Plans.
Firstly, you'll notice that the Savings Plan and Reservation coverage has a counterpart chart - the utilization reporting. This is great, but I had no idea what it meant in terms of dollars if the percentage dropped below 100
This exploration was tipped off by my discovery of the savingsPlan/UsedCommitment column, while diving around in the docs. By the way - I dive around in docs without aim a lot. Just saying. You learn a lot that way. So let's start at the top, with a computed column I call Total Amortized SP cost:
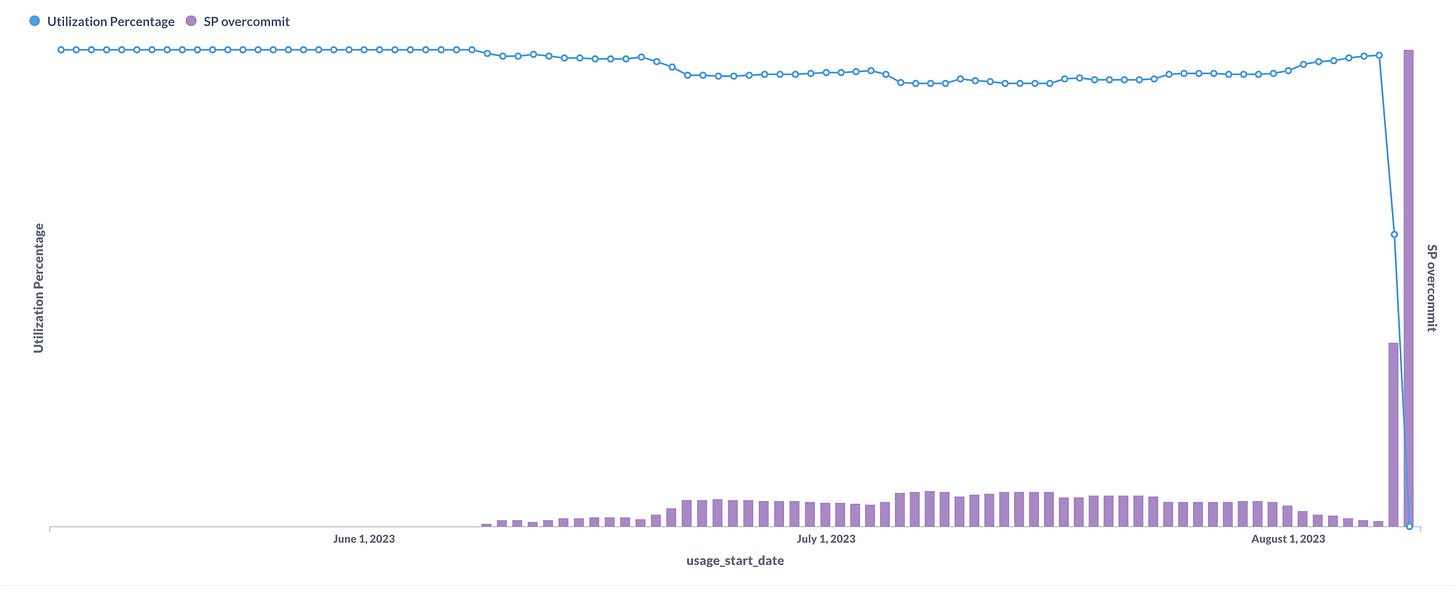
When filtered to only include line items WHERE line_item_type = "SavingsPlanRecurringFee" you get the total cost of your savings plans for that time period, including the amortized upfront payments. So this is pretty simple now, you go sum(totalSPCost) - sum(SP_used_commitment) and if you wind up with anything more than 0, you have overpurchased your Savings Plans.
Now you can do some relatively simple math to calculate your utilization percentage -
And if you plot both of those metrics together on the same chart -
So ideally you want the blue line stuck to the ceiling and no purple bars at all but here in the real world, when stakeholders start yelling at you about on demand spend as this unequivocal evil to be avoided at all costs, this can happen. It's super helpful if you already have some reporting like this ready to show them the flip side and to help them understanding that optimizing for this one metric is rarely a good idea in life or business. Indeed, we've been doing really good this year at strategizing about how we can start optimizing hardware inventories, and after spending Q1 getting the business about our on demand spend, now we have the opposite problem.
Fortunately, SPs are expiring on their own and bringing that overcommit number back down, but I never want to see this happen again. I share my shame so that hopefully you don't have to.
Reservation Utilization
As you can see from the main image at the top, we chose to start moving out of reservations and into savings plans a little over 3 years ago. Our inventory has been almost entirely converted at this point, so I don't have a lot to offer on how to monitor reservation utilization. My hunch is that it's very similar to SP utilization though, I'll update this post when I have time to dig in a little bit.


